The BCG Pension Insider
February 2023 – Volume 136, Edition 1
Pension Risk Transfer Market Observations in Five Charts
- At 12 years, The BCG PRT Index (PRT Index) is the longest standing pension buyout index in the United States.
- The PRT Index provides easy comparison of annuity pricing to various important pension liability measures.
- Participating insurers include American National, Athene, Corebridge Financial, Fidelity & Guaranty, Legal & General, MassMutual, MetLife, Midland National, Mutual of Omaha, OneAmerica, Pacific Life, Principal, Prudential, Securian Financial and Western & Southern.
With many plan sponsors and advisors considering what pension de-risking strategy may be best for their defined benefit plan in the current environment, we set forth below important pension risk transfer (PRT) market observations in five charts.
Charts taken from BCG Pension Risk Consultants I BCG Penbridge’s (BCG) PRT Index charting tool, which was established in 2011.
The BCG PRT Index (PRT Index) Charting
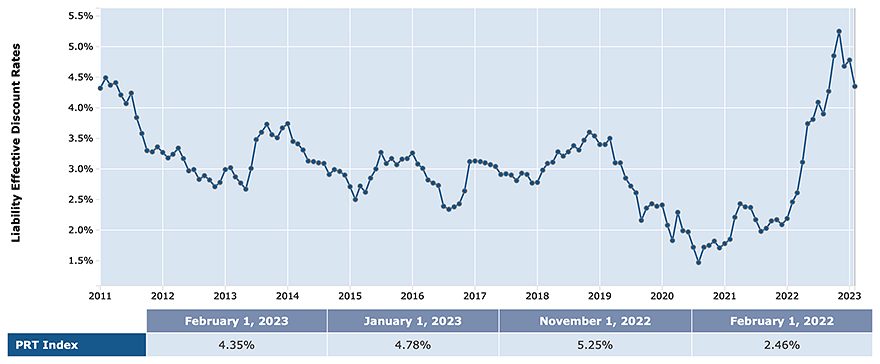
Chart 1 – Effective Rates: PRT Index
- The PRT Index measures the interest rate basis (and liability) for an annuity purchase for a theoretical sample plan, comprised of retired as well as non-retired participants.
- On its own, the PRT Index highlights how the absolute cost of annuities has changed and how it has drastically declined over the past year, as interest rates have risen.
- Compared with other benchmarks (e.g., accounting liability, as measured by the FTSE curve), the PRT Index provides the information upon which plan sponsors can make informed decisions (with BCG’s assistance as needed) regarding annuity placements, lump sum offers, plan termination, minimum funding decisions, PBGC elections, and accounting measurements.
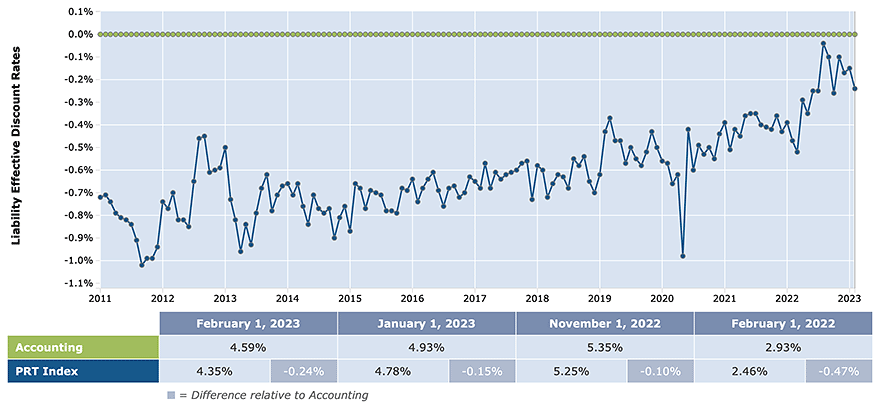
Chart 2 - Effective Rates: PRT Index with Reference Basis: Accounting
- Interest rates used for annuity purchases have generally been lower than interest rates used for accounting purposes.
- Over the past decade, the difference between annuity purchase and accounting interest rates has shrunk considerably.
- Today’s annuity market provides the best annuity pricing ever (relative to accounting liability), with annuity pricing more or less the same as the accounting liability (and often slightly less than the accounting liability).
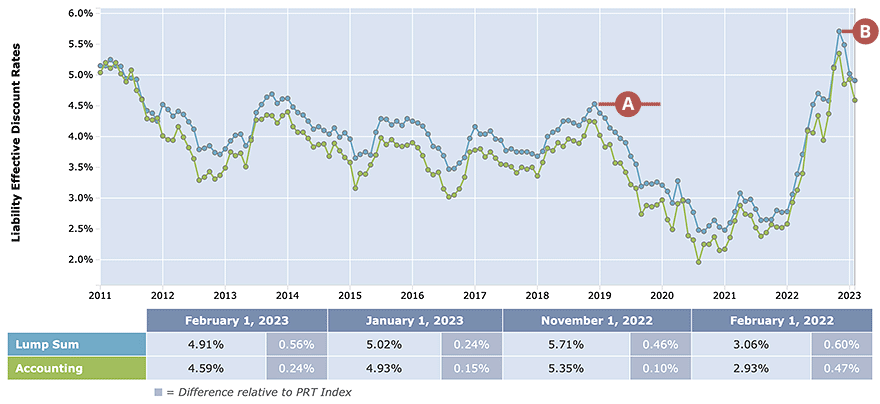
Chart 3 – Effective Rates: Lump Sum Basis vs. Accounting Basis
- With lump sum rates changing once per year (for most plans), certain years present “arbitrage” opportunities for lump sum windows, while in other years, it’s more advantageous for sponsors to avoid lump sum payments.
- For example, lump sum rates from November 2018 were noticeably higher than accounting rates throughout 2019 (see red line A in chart), meaning plans were able to recognize gains by offering lump sums in that interest rate environment. The same conditions are presenting themselves in 2023, given lump sum rates hit a high point in October 2022, and interest rates have since declined.
- Not all plans have the flexibility to select a new month’s lump sum interest rates (such as October 2022) – but it may be worth exploring, especially now that the red line (see red line B in chart) will once again likely be above accounting rates in 2023.
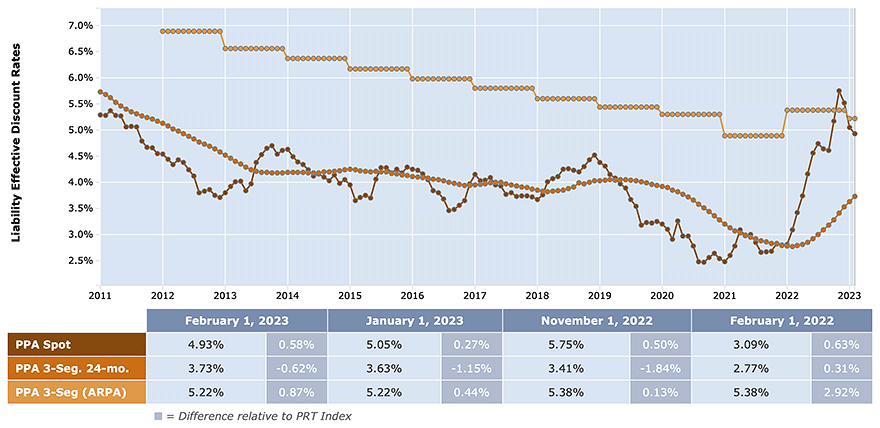
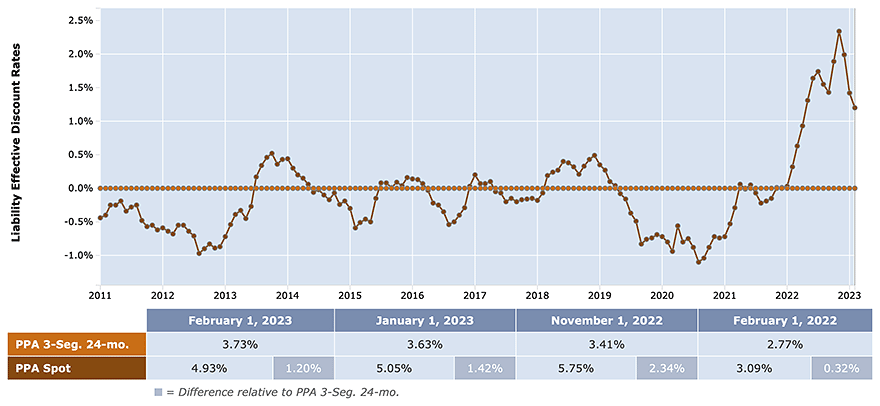
Chart 4 – Effective Rates: PPA Basis (PPA Spot vs. PPA 3 Segment 24-month vs. PPA 3 Segment (ARPA))
- Minimum funding (ARPA) interest rates, which average interest rates over 25 years, have (generally) been falling slowly since 2012 (with a bump upwards in 2022 due to legislative changes).
- Without the 25-year averaging, the (PPA) spot segment rates have generally been well below the ARPA interest rates, but that suddenly changed in 2022 – meaning that use of the “full yield curve” of interest rates, without the “25-year averaging” relief, will provide results similar to the ARPA interest rates.
- The smoothed, 24-month segment rates (used for PBGC purposes for many plans) still lag well below the other two measures, but have turned upwards, and are expected to continue moving towards the ARPA interest rates as the lower rates which occurred prior to 2022 fall out of the 24-month averaging period.
Chart 5 – Effective Rates: PPA Spot Basis with Reference Basis: PPA 3 Segment 24-month
- The 24-month smoothing of spot (PPA) interest rates has produced mixed results, with the smoothed rates (the reference basis line) sometimes producing higher rates, and sometimes lower rates than the non-smoothed, spot rates. These are the two methodologies commonly used for calculating PBGC premiums.
- The non-smoothed, spot rates currently provide much higher interest rates, making this the preferable method (in 2023, and likely 2024) for calculating PBGC premiums. And, while some sponsors may be “locked in” to using the smoothed interest rates for PBCG purposes, there could be alternatives that will reduce PBGC premiums.
How Can BCG Help
BCG’s singular focus is to bring defined benefit plan sponsors and advisors actionable analysis for ongoing plan management, de-risking and pension risk transfer. BCG helps our clients identify, objectively evaluate and implement strategies to efficiently reduce pension cost and risk. We have deep experience in helping clients with the full range of pension de-risking strategies from liability driven investing approaches to partial or full pension risk transfer, including navigating the complex and lengthy process of plan termination.
To learn more about customizing The BCG PRT Index to a specific defined benefit plan, contact us.
Contact Us
Steve Keating, Managing Director
BCG Pension Risk Consultants | BCG Penbridge
T: 203-955-1566
E: skeating@bcgpension.com
LinkedIn
ANNUITY PURCHASE RATES
Sample Interest Rates for a Pension Annuity Buyout
(Assumes no lump sums, disability, or unusual provisions)
Retirees (duration of 7) – 4.37%
Term Vesteds (duration of 10) – 4.36%
Actives (duration of 15) – 4.30%
Annuity Purchase Rates as of February 1, 2023
